Gold’s London AM fix this morning was USD 1759.50, EUR 1,335.48, and GBP
1,110.66 per ounce.
Yesterday's AM fix was USD 1,747.50, EUR 1,326.68, and GBP 1,102.80 per
ounce.

Gold prices hit their highest since mid-November this morning as signals that
U.S. monetary policy will remain ultra loose increased investor appetite for
bullion.
Gold bullion has gained over 12% so far in 2012, and the ascent was
rejuvenated last week with Bernanke’s commitment to keep interest rates low and
money loose through 2014.
Spot gold hit a high of $1,762.90 before falling a few dollars to $1,757/oz
by midday in Europe.
Concerns about the jobs number later today is also supporting bullion.
Investors will be watching the US nonfarm payrolls report at 1300 GMT, after
yesterday's data showed a surprise drop in jobless claims for last week which
led to a pop in gold as did Bernanke’s testimony.
Spot palladium hit a 4 1/2 month high of $713.50. The metal used primarily
for producing autocatalyses for gas powered engines, is supported by US auto
sales which rose 11% this January, its best sales data in 2 1/2 years.
Gold Bullion Coin and Bar Demand Remains Robust – Tiny Vis-à-vis
Other Investments
Data internationally shows that demand for gold bullion bars and coins
remained robust in 2011 and into January 2012.
Demand is strong amongst the gold buying public but remains a fringe activity
of store of value buyers rather than a mainstream phenomenon. At this stage very
few retail investors have any allocation to gold whatsoever and very few have
even owned a gold coin or bar in their life.
This is slowly beginning to change with a small minority of retail investors
beginning to diversify into gold in order to protect against systemic risk in
the banking and financial sector (MF Global) and from the monetary risk of
currency debasement.
In Australia, the Perth Mint has reported very strong demand for gold and
silver coins in recent weeks. The mint is a major supplier of coins to the UK
and Europe.
Perth Mint’s sales director, Ron Currie told the Wall Street Journal that
gold coin sales during December and January are up around 80% compared with the
same months a year earlier, while silver coin sales have doubled. The mint’s
largest markets for coin demand include Germany and the U.S.
However, demand for gold bullion coins and bars remains tiny vis-à-vis
capital invested in stocks and bonds and vis-à-vis cash on deposit.
This suggests that the recent uptick in demand for gold coins and bars is
very sustainable – especially against the backdrop of the challenging
macroeconomic, systemic, monetary and geopolitical risk in the world today in
2012. A backdrop that is likely to be with us for the foreseeable future.
Sales of gold American Eagle coins this month total 114,500 troy ounces, the
highest volume in a year and the most since 133,500 in January 2011. This, in
turn, was the highest month since sales topped 150,000 ounces in May, June and
July of 2010.
Figures from the U.S. Mint show an 18% decline in gold American Eagle sales
in 2011 from the previous year, although sales of the silver Eagles still rose
15%.
Silver remains more affordable than gold and many bullion investors see
greater value in silver bullion. Some expect the gold silver ratio to continue
to fall with many believing, like GoldCore, that the gold silver ratio will fall
to 15:1 in the coming years.
American Eagles—the world's most popular minted bullion coins—are generally
viewed as a good indicator of retail investment demand for bullion –
particularly in the U.S.
Research: US Mint Gold Coin Sales for January - Signal Return to
Fundamental Driven Demand?
Dr. Constantin Gurdgiev, a non Executive member of the GoldCore
Investment Committee, has analysed the data of US Mint coin sales in January and
has looked at them in their important historical context going back to
1987.
January data from the US Mint on sales of gold coins presents an interesting
picture, both in terms of seasonality and overall demand for the asset
class.
Some background to start with. Gold prices have been moving sideways with
some relatively moderate volatility in recent months. Between August 2011 - the
monthly peak in US Dollar-quoted price and January 2012, price has fallen 4.55%,
but in the last month, monthly move was 10.82% and year on year prices are up
30.4%.
Crisis-period average price is now at USD1,154/oz and the standard deviation
in prices is around 337 against the historical (1987-present) standard deviation
of 330. In 2011 standard deviation for monthly prices stood at 144(small
sample-adjusted), well below historical volatility, due to a relatively
established trend through August 2011. However, prices returned to elevated
volatility in August 2011-January 2012.
These price dynamics would normally suggest rising caution and buyer demand
reductions over time. And to some extent, this sub-trend was traceable in the
data for US Mint sales in some recent months too.
For example, unadjusted for seasonal variation, August 2011 sales of Mint
coins peaked at 112,000 oz with relatively moderate 0.67 oz/coin sold gold
content. By November 2011, sales slowed down to a relative trickle of 41,000 oz
at 0.71 oz/coin sold. December sales came in at 65,000 oz with gold content on
average of 1 oz per coin sold.
Much media hullabaloo ensued with calls for catastrophic fall off in demand.
There were renewed claims that a gold bubble is now in action and the decline in
coinage sales is evidence of that.
In reality, there was very little surprising in the sales trends
overall.
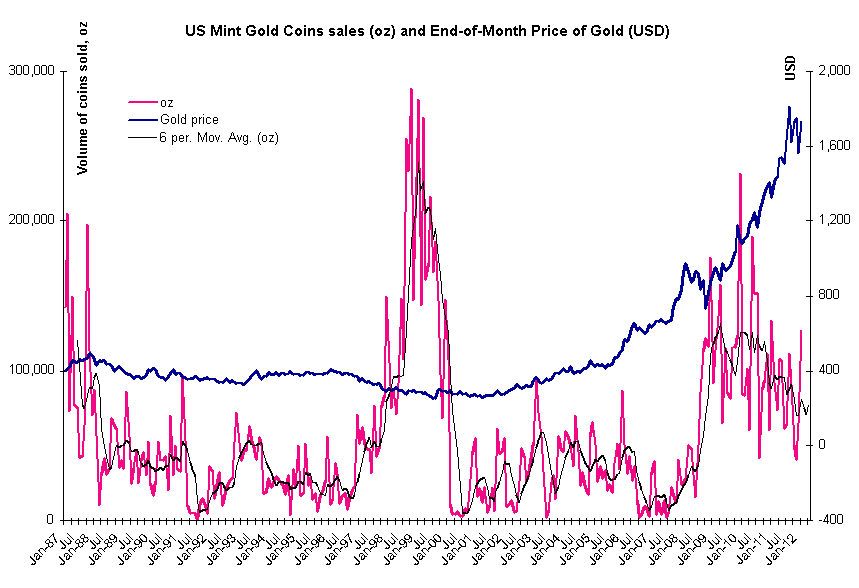
Chart 1 below shows US Mint sales in terms of the number of coins sold. Care
to spot any dramatic bubble-formation or bubble-deflation here? Not really.
There is a gentle historical upward trend since January 1987. There is
volatility around that trend in 2010 and far less of it in 2011. There is
seasonality around the trend with Q1 sales uplifts in January, some Christmas
season buying supports in early Q4 etc. There is also a slightly elevated
sub-trend starting from early 2009 and continuing through today. More
interestingly, the sub-trend is mean-reverting (heading down) which is -
dynamically-speaking stabilizing, rather than 'bubble-expanding' or
'bubble-deflating'.
Chart 1
 Source: US Mint and author own
analysis
Source: US Mint and author own
analysis
Now, January sales are strong in the historical context and within the
sub-trend since 2009. January 2012 sales of US Mint coins came in at 127,000 oz
with relatively low 0.50 oz/coin sales. So coinage sales in terms of oz weight
are 95.4% up on December, but 4.9% down on January 2011. For comparison, 2011
average monthly sales were 83,292 and crisis-period average monthly sales were
94,745 all at least 0.5 standard deviations below January 2012 sales. As chart
above clearly shows, sales are now well ahead of historical averages and above 6
months moving average.
However, as chart below shows, sales in January were well below the trend
line for average coin weight for sold coins: oz per coin sold is down 50.5% mom
and down 43.1% year on year. Significantly, smaller coins were sold in January
this year than in 2011. 2011 average oz/coin sold was 1.0 and the latest sales
are closer to 0.59 oz/coin historical average.
Chart 2
 Source: Author own data and analysis
based on underlying data from the US Mint
Source: Author own data and analysis
based on underlying data from the US Mint
There is no panic in the overall trends in demand for coins when set against
the price changes, with negative general trend in correlations between demand
and gold price established in mid-2009 continuing unabated, as shown in Chart
3
CHART 3
 Source: US Mint, World Gold Council and
author own analysis
Source: US Mint, World Gold Council and
author own analysis
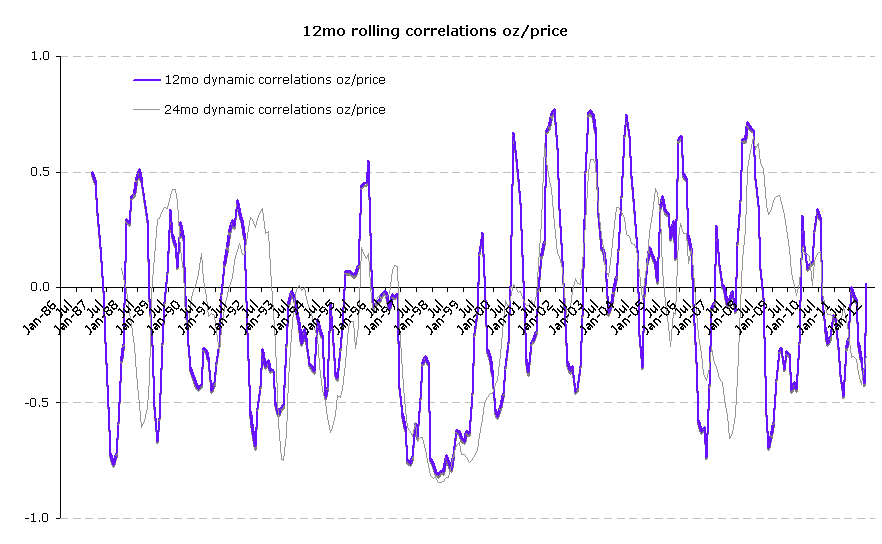
However, when we look closer at the 12 months rolling correlations and 24
months rolling correlations, the picture that emerges for January is consistent
with gentle negative correlation that has been present since the beginning of
2011. See Chart 4 below. January 2012 12mo rolling correlation between gold
price and volume of gold sold via US Mint coins is +0.02, having reverted to the
positive from -0.42 in December 2011. This is the first positive (albeit
extremely low) monthly 12mo rolling correlation reading since July 2010. 24 mo
rolling correlation in January 2012 stood at benign -0.30, slightly up on -0.34
in December 2012. Again, resilience if present in the longer term series and at
shorter horizon there are no huge surprises either. Of course, in general, one
can make a case, based on the recent data, that investors are simply turning
back to the specific instrument after gold price corrected sufficiently enough.
In this light, latest US Mint data would be consistent with
fundamentals-supported firming of demand. But crucially, there is no evidence of
either panic buying or selling.
CHART 4
 Source: Author own analysis based on
the data from US Mint
Source: Author own analysis based on
the data from US Mint
Lastly, let's take a look at seasonally-neutral like-for-like January sales.
Chart below shows data for January sales, suppressing the huge spike at 1999.
Clearly, sales are booming in terms of coins numbers sold. But recall that coins
sold in January 2012 are smaller in gold content, so overall gold sold via US
Mint coinage is marginally down on January 2011, making January 2012 sales the
fourth highest on record.
CHART 5
 Source: Author
own analysis based on the data from US Mint
Source: Author
own analysis based on the data from US Mint
The Table below shows summary of US Mint coins sales for 3 months
November-January covering holidays periods sales, including the Chinese New Year
sales. While January 2012 period shows healthy sales across all three
parameters, there is still no sign of any panic buying by small retail investors
anywhere in sight here. Sales are ticking nicely, in 2011 and 2012, well ahead
of 2001-2008 levels (confirming lack of perception in retail environment that
general sustained price appreciation is a signal to dampen demand), but behind
2009-2010 spikes (further confirming the view that 2011-2012 dynamics are those
of moderation in the precautionary and flight-to-safety motives for demand, and
more buying on long-term gold fundamentals).
Source: Author own analysis based on the data from US
Mint

Welcome back to ‘normalcy’ in US Mint sales.
Once again, the evidence above does not imply any definitive conclusions as
to whether gold is or is not a “bubble”. Instead, it points to one particular
aspect of demand for gold -- the behaviourally anchored, longer-term demand for
gold coins as wealth preservation tool for smaller retail investors.
It does suggest that there is little in the way of ‘animal spirits’ in the
gold market with no signs of a gold mania or ‘gold rush’ whatsoever.
Given the state of the US and other advanced economies around the world since
January, 2008, U.S. Mint data does not appear to support the view of a dramatic
over-buying of gold by the fabled speculatively crazed retail investors that
some media commentators are seeing nowadays.
The man and woman in the street in most western countries (except for
Germany, Austria and Switzerland) continues to be a more of a seller of gold
(jewellery into scrap) than a buyer of gold as seen in the western world
phenomenon that is ‘cash for gold